S o f t w a r e     f o r     a u t o m a t i c     c r e a t i o n     o f     m o d e l s     u s i n g     p a r a m e t r i c     d a t a

  Arch Bridges Software

Case study & Reseach
ICDAS YouTube Channel   ICDAS ARB 2024.00R 


Page 1  2  3  4  5
123456789_123456789_1123456789123456789_123456789_123456789_123456789_123456789_123456789_1123456789_ 123456789_123456789_123456789_123456789_123456


Arch Bridge Model
Examples


Model description


Input


BIM model


Analysis model


Landscape model


Basis of Design &

Documentations


Workflow of Software


Additional features


Rendering, Animation &
Vitural Reality


Case Study and 
Research


Subscription 


Case Study Hangers density determine frequencies of Arch Bridges


This case study applies ICDAS AB 2015.00R 


 Main Input: He 100, Hs% 25, Ls 100, DZB 12, HangSeg 10


Figures below compared frequencies of arch bridge with reduced hanger's density. All hangers are assumed

non-tensioning and having normal beam element BMS3.


 Reference: Hangers Density 7.85t/m3, First & Last node End Releases RY, fREF=0.405Hz

123456789_123456789_1123456789123456789_123456789_123456789_123456789_123456789_123456789_123456789_ 123456789_123456789_123456789_123456789_1234567


123456789_123456789_1123456789
Reference: The hangers are visible. The centre hanger is 22.4m long, having a big vibrational amplitude
                   that make the bridge vibration invisible.


Case1: Hangers Density 7.85t/m3, First & Last node End Fixed Rotation RY

           f=0.872=2.14fREF. The hangers fixed rotation increase the natural frequencies significantly!


Case2: Hangers Density (7.85*0.10)t/m3, First & Last node End Releases RY.

           f=0.943=2.33fREF. The hangers vibration are visible together with the bridge.


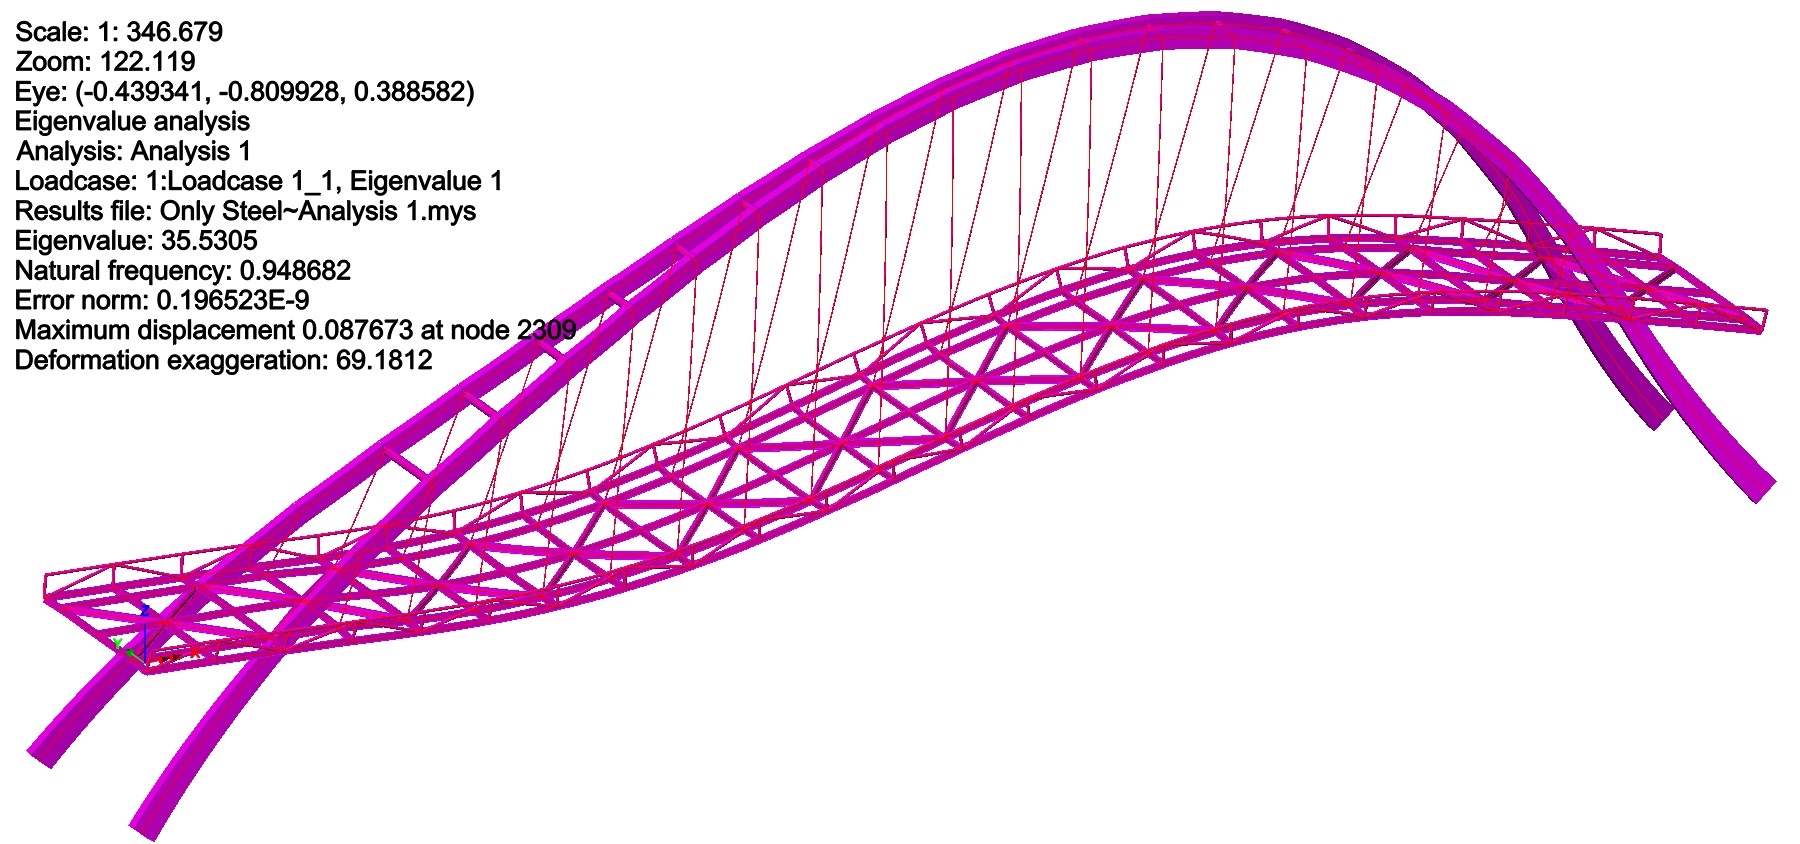
Case3: Hangers Density (7.85*0.010)t/m3, First & Last node End Releases RY.

            f=0.948=2.34fREF. The hangers weight are almost overlooked with only 1% of density, the hangers are
           vibrated without local amplitudes compared to Case2 (10% of density).


Case3: In 3D View. See Animation

Page 1  2  3  4  5

Updated 20-06-2018


123456789_123456789_1123456789
ICDAS  •  Hans Erik Nielsens Vej 3  •  DK-3650 Ølstykke  •   
E-mail: th@icdas.dk   •  Tel.: +45 60 53 83 79  •  CVR no.: 34436169